Geoneon Wildfire Severity Index


A scalable dataset with transparent pricing, eliminating geographical limitations and minimising the dependency on traditional field measurements or airborne surveys.

AI-powered processing not only accelerates the initial mapping process but also allows for fast and consistent updates.

Designed for easy integration into any GIS workflow without the need for complex system changes or specialised training.
A scalable dataset with transparent pricing, eliminating geographical limitations and minimising the dependency on traditional field measurements or airborne surveys.
AI-powered processing not only accelerates the initial mapping process but also allows for fast and consistent updates.
Designed for easy integration into any GIS workflow without the need for complex system changes or specialised training.

Standard
AU$3/km2
Product Description
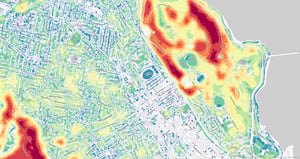
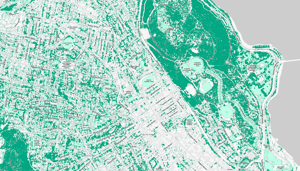
Provides essential 10 m resolution mapping for broad areas.
Minimum order of 10,000 km2.
High-Res
AU$300/km2
Product Description
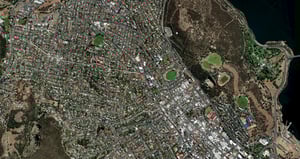
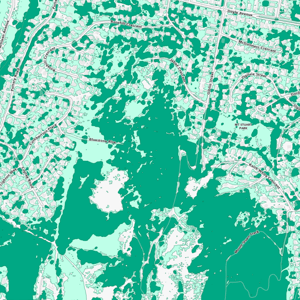
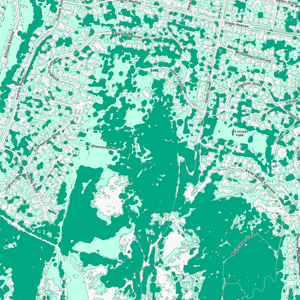
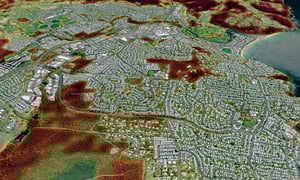
Delivers detailed 50cm resolution mapping critical for applications in urban and infrastructure settings.
Minimum order of 100 km2.
Combined
Contact us for pricing
Product Description
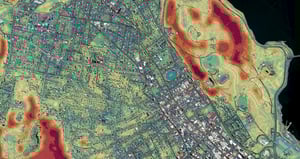
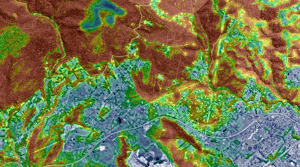
Combines 10m and 50cm resolution mapping for versatile urban and rural projects.
Minimum order of 5,000 km2.
Ready to revolutionise your approach to wildfire severity mapping?
Click the button below to connect with our sales team today. Start your journey toward smarter, more proactive wildfire risk management now.Learn about Geoneon Wildfire Severity Index and how our customers leverage this product
Geoneon, a leader in geospatial technology and climate risks, is proud to announce the launch of its revolutionary platform dedicated to assessing bushfire exposure in the Greater Hobart area.
Read More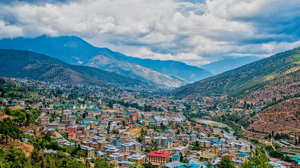
Geoneon, in partnership with the Bhutanese Government, has initiated a project to develop an open-source tool for assessing the vulnerability of critical infrastructure to climate hazards.
Read More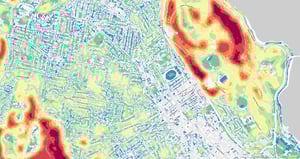
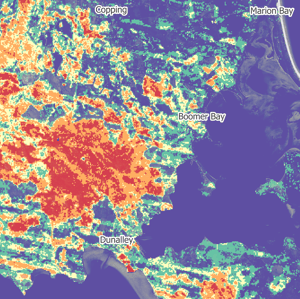
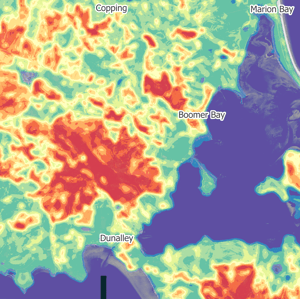
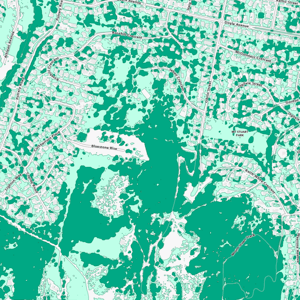
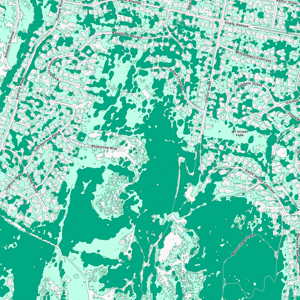
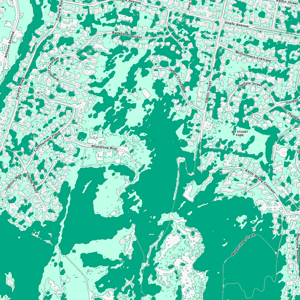
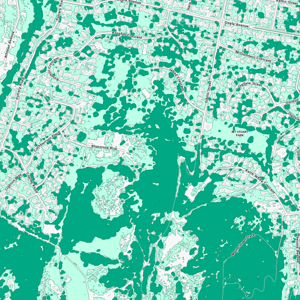
Discover our innovative approach to
wildfire severity, blending Al technology
with advanced satellite imagery.
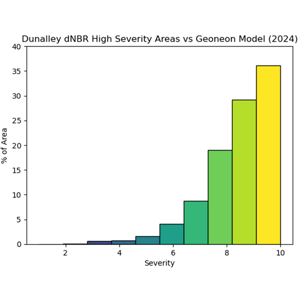
Get a glimpse of the wildfire severity index.
Experience the power of high-resolution wildfire severity mapping to enhance your environmental and infrastructure projects.